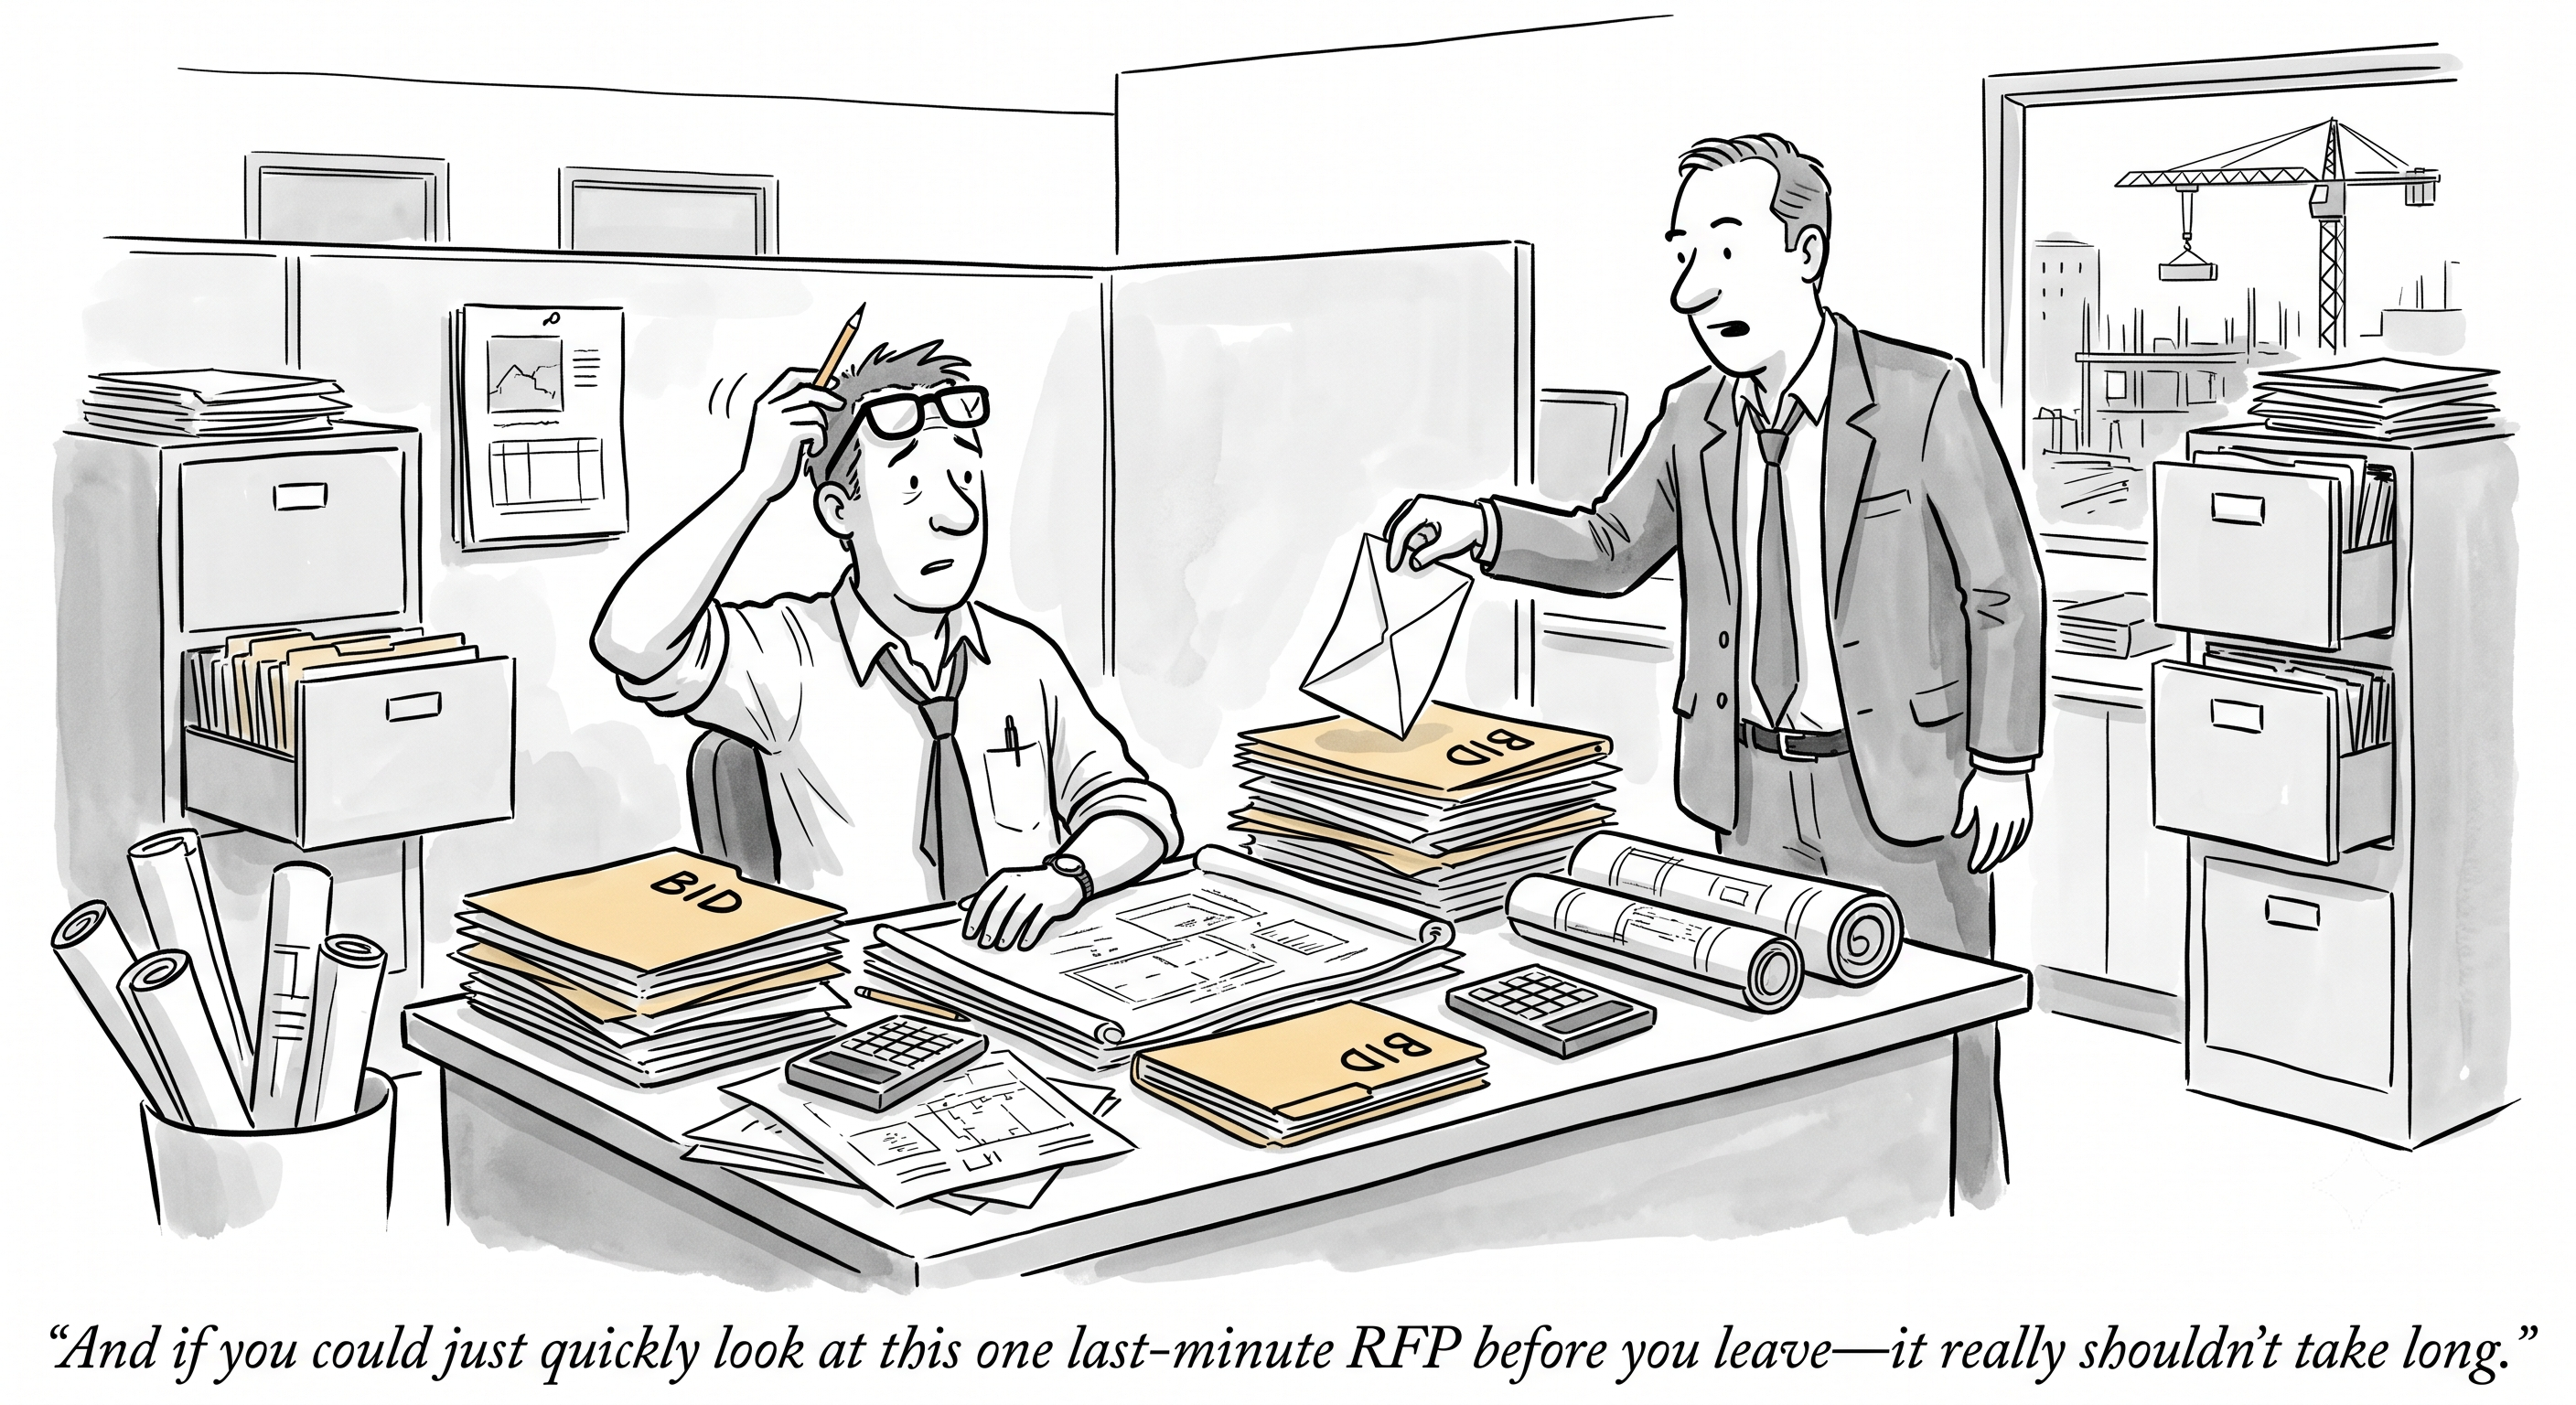
TL;DR — Ask a contractor their gross margin and they will tell you to the decimal. Ask what percentage of their bids they win and most will give you a number they cannot source. That is not a knock on contractors; it is a gap in the industry. The Construction Financial Management Association has benchmarked contractor financials since 1989 across more than a hundred ratios, and not one of them measures whether a firm wins work efficiently. The most recent real US hit-rate benchmark is a survey of 303 firms taken in July 2015. Into that vacuum has poured a confident “25% industry average” that traces to no study at all — one widely circulated version attributes it to an AGC report that contains no such statistic. Nor has anyone independent established the other half of the equation: the only published measurement of what a pursuit costs comes from a software vendor’s own survey, and no study shows whether bidding more raises your win rate or lowers it. The go/no-go call is the highest-leverage decision in preconstruction, and the industry has left it almost entirely unmeasured.
The decision nobody scores
Part 1 of our earlier series was about what hides inside a bid: the spec section nobody had time to read. This is about the bid itself — the one that arrived in the inbox, got a “sure, let’s take a look,” and quietly consumed three weeks of senior estimating time before losing to a number you were never going to beat.
Tom Porter, Vice President – General Counsel for LeChase Construction and a veteran of more than thirty years in the industry, put the stakes plainly. “The go/no go decision is the separation of opportunities into those that will be pursued and those that will not,” he wrote. “This is one of the most important business processes in any construction business.”
It is also, at most firms, the least instrumented. There is a scorecard for safety, a scorecard for schedule, a scorecard for job cost. For the decision that determines where every one of those resources gets pointed, there is usually a hallway conversation.
Part of the reason is structural. In a 2022 survey of 979 industry participants by FMI and Procore — a global sample, only a quarter of it US-based — fewer than half of general and specialty contractors, 45%, had “a formal, standalone preconstruction department or dedicated preconstruction staff.” Among general contractors the single most common arrangement was preconstruction handled as a function of project management staff. So the decision about which pursuits to resource is frequently made by people who are already fully committed to something else.
The number that does not exist
Here is what happens when you go looking for the benchmark.
Search for the average commercial contractor’s win rate and you will find 25% repeated with total confidence across a dozen sites. Follow the citations and they collapse. One prominent version attributes the figure to AGC of America’s 2026 Construction Hiring and Business Outlook. We downloaded that report and searched it: it contains no win-rate statistic. Its only references to bidding concern pipeline confidence and bid pricing. Other versions cite “research analyzing over 1,000 construction projects” with no author, no journal, and a sample size that changes between paragraphs.
The mechanism behind this is worth understanding, because it has become industrialized. While preparing this piece we chased a confidently repeated claim that AGC’s “2025 Preconstruction Efficiency Study” found mid-size general contractors lose 11.4 hours per bid to manual data transfer between disconnected software tools. AGC’s own site search returns no results for it. AGC runs exactly three recurring surveys — the Hiring and Business Outlook with Sage, the Workforce Survey with NCCER, and a work-zone safety survey with HCSS — and none of them is a preconstruction efficiency study. The trail ends at a single AI-generated vendor page, where the phrase appears in lowercase, mid-sentence, as “according to AGC’s 2025 preconstruction efficiency study.” Somewhere downstream a descriptive clause got title-cased into a publication, and the publication acquired a reputation. The same page also cites an “AGC 2025 productivity benchmark,” which likewise does not exist.
That is the entire laundering cycle. A vendor page invents an authoritative-sounding attribution; AI-generated search summaries repeat the claim stripped of its source; within a few hops it is a benchmark everyone has heard of and nobody has read. We were served two such summaries asserting these exact nonexistent AGC publications as fact while we were checking this story. The same pattern produced a widely cited “4 to 8 bids per estimator per month” benchmark attributed to ABC National, which does not track the metric at all — the nearest real artifact is one ABC chapter’s marketing blog citing an unsourced “3-5 bids/month per estimator.”
None of this is a reason to distrust estimating data in general. It is a reason to check who counted, how many, and when — and to notice how rarely those questions have answers.
The real benchmark is thinner and much older. The SMPS Foundation collected 303 responses from North American architecture, engineering, and construction professionals in July 2015 and published the results in 2016. Overall hit rate across all methods: 42.07%. Construction firms specifically: 37.91% — though that figure rests on roughly 55 respondents, since construction is a minority of the sample. It is now a decade old, it skews toward the qualifications-based work that SMPS’s marketing membership tends to pursue, and no one has replicated it since. Notably, 93% of respondents said they used hit-rate data to improve their go/no-go process — the firms that measure it, use it.
What about the institutions that benchmark everything else? CFMA’s Construction Financial Benchmarker has been running since 1989; its 2024 edition draws on 1,290 companies with validated financial statements. It measures liquidity, profitability, leverage, efficiency, productivity, and the full balance sheet — some 150 metrics in all. It does not measure bid-hit ratio or win rate anywhere. On the sales side it carries exactly two: total revenue and sales growth. AGC’s three recurring surveys do not measure win rate either.
So the industry can tell you, precisely, that best-in-class contractors run SG&A at 10.8% of revenue. It cannot tell you what share of that spend goes to work they never won.
What a pursuit actually costs
You can build the labor cost from government data, and it is worth doing because the inputs are unarguable.
The Bureau of Labor Statistics puts the mean annual wage for cost estimators in nonresidential building construction at $101,150 as of May 2025. Divide by 2,080 hours and load it with the BLS Employer Costs for Employee Compensation benefit ratio for early 2026 — benefits run 30.1% of total compensation, a multiplier of about 1.43 — and a commercial estimator costs roughly $70 per hour, fully loaded. Every figure there is federal data.
Now multiply by the hours in a pursuit. And here the trail goes cold, because no independent body measures that. Not ASCE, not the academic literature, not any of the trade associations. There is no neutral published distribution of hours per commercial estimate, no bids-per-estimator figure, no preconstruction headcount benchmark.
What exists instead is vendor research — and it is worth looking at directly, both for the numbers and for what the numbers cannot tell you. In July 2026, ContraVault AI, a company that sells an AI takeoff engine, published The State of Industrial Estimation 2026 together with a practitioner community that supplied its panel. It reports a median of 27 bids submitted per estimator per year (41 in the top quartile, 18 in the bottom), a median firm carrying roughly one estimator for every $18–22 million of annual bid volume, and a median of 32 hours to take off and price a mid-size package.
Those are very nearly the only numbers of their kind in existence, and they may well be directionally right. They still cannot serve as an industry benchmark, for four reasons worth stating plainly.
The sample is self-selected. 312 respondents drawn from a community adjacent to the vendor is not a probability sample of contractors. Firms that join estimating-technology communities are not a random draw from the industry; they are, almost by definition, the firms already worried about estimating capacity.
The data is self-reported. Nobody audited a timesheet. “How many hours does a mid-size package take?” is a question estimators answer from memory, in a context that quietly rewards a large answer.
The headline index is constructed, not measured. The report’s own methodology note concedes that its capacity index is “calibrated to the benchmark bands rather than derived from raw responses.” The bands came first.
The party publishing the measurement sells the remedy. That does not make the numbers false, and it is not an accusation of bad faith. It means every degree of freedom in the study — who was asked, how each question was framed, which cut became the headline — points in a single commercial direction. Tellingly, the same report carries a 22% median hard-bid win rate, landing within a rounding error of the unsourced “25%” circulating everywhere else. When vendor research converges on the number the market already believes, that is not corroboration.
There is a practical problem too. The report sits behind a lead-capture form, has no archived copy anywhere, and can be revised or withdrawn by its publisher at will. A benchmark you cannot re-check next year is not a benchmark; it is marketing with a methodology section.
So the vacuum is still a vacuum. The only organization that has bothered to measure what a pursuit costs is one that needs the answer to be alarming.
The only serious measurements of what bidding costs contractors are British, survey-based, and old. A University of Reading study put average bid cost for contractors under the general contracting route at 0.81% of the value of the work to the bidder — though in its cleanest subset of a dozen real main-contractor bids the average was 0.12%, and the authors concluded there was “simply no correlation with different methods of procurement.” A 2014 UK survey drew 179 respondents, 118 with usable cost data, covering £11.3bn of bid value, and found bid costs of 0.57% of total project value, split 0.65% on bids that won and 0.48% on bids that lost.
Those numbers are UK, self-reported, older than most of the software now sold to fix the problem, and they scatter across nearly an order of magnitude. The scatter is the finding. Nobody has established what a pursuit costs, even approximately, in terms a US commercial contractor could benchmark against.
There is also a trap in how such percentages get repeated. A cost stated as a share of bid volume and the same cost stated as a share of revenue differ by exactly your win rate — the identical spend can be presented as a rounding error or as a serious drag depending on which denominator the speaker picked. Almost nobody says which they mean. That is precisely how a figure like “0.5% to 2% of revenue” can be made to mean anything at all.
FMI’s preconstruction research names the consequence without needing a number, listing among contractors’ chief frustrations the “expanding, unrecoverable overhead associated with preconstruction activities” and “overburdened, frustrated and burnt-out preconstruction departments and personnel.”
Does bidding more actually work?
You would expect this to be settled. It is not — and the reason is the same as before. Nobody has properly checked.
The closest thing in the literature is a study by Alkhateeb, Hyari and Hiyassat covering 2,296 bidding attempts across 289 tender projects announced by Jordan’s Government Tenders Department between 2013 and 2016, at an average success rate of 13.3%. What it actually establishes is narrower than it is usually made to sound: a contractor’s classification category and work sector affect how competitive their bids are, but do not affect their success rate. The authors go on to suggest that contractors “cannot depend on their experience (i.e. classification category) or increasing bidding attempts to win bids and improve bidding success rate, rather than enhance their bidding strategy” — but that is an implication they draw in closing, not a relationship they tested, and the setting is Jordanian public procurement rather than US commercial building.
So the honest position is not that bidding more has been proven useless. It is that the question has never been answered, and firms are making the bet in both directions on instinct.
What we have instead is testimony from people who have watched it happen.
George Hedley, who ran a construction company before becoming an industry coach, described the mechanism from the inside: “Over the years, our construction company wasted lots of time bidding jobs we wouldn’t get unless our bid was extremely low. When your estimating department is too busy bidding too many jobs you can’t get, they won’t win the jobs you want.” Elsewhere he is blunter about the compounding effect: “When you dilute your estimating staff, it lowers your chances of winning good projects.”
He made the same point again in 2020: “When your estimating department is busy bidding too many jobs you can’t get without a low price, they generally pass on the good jobs they should be going after.” And on volume as a growth strategy: “Simply bidding a higher volume of projects is never the way to grow a successful construction business and make more money.”
The cost of a yes is not the cost of that pursuit. It is the pursuit you did not staff properly because of it. Wade Carpenter, a CPA whose practice specializes in contractors, framed it as capacity theory: “every yes that we say just because we can do the work is taking your estimator time, your project manager, all the field labor.” Marginal jobs, as he put it, “steal the attention from the profitable jobs.”
And sometimes you win
The failure mode that gets discussed is losing. The expensive one is winning.
Ben Wilhelm, then with the employee-owned ENR Top 400 contractor Shiel Sexton, wrote a clear-eyed account of the winner’s curse: “bidding low enough to win, but regretting the results.” His description of what contractors do next is the uncomfortable part. Firms attempt to escape it, he wrote, by “(1) bid withdrawal in public and private domains, (2) pushing the risk to the subcontractor by squeezing their pricing or making alternate arrangements, or (3) recovery through inflated change orders. These approaches effectively compromise trust, honk off everyone in the supply chain, or worse, cause a company to have an irrecoverable economic failure.”
The idea has a name and a real literature behind it, though a more contested one than the phrase suggests. A 2016 study in ASCE’s Journal of Construction Engineering and Management, simulating bidding behavior against an actual Caltrans project dataset, concluded that “the majority of general contractors and subcontractors suffer from the winner’s curse,” and that multistage bidding — where a GC’s number depends on subcontractor numbers — produces more losses than single-stage, while also giving contractors more opportunity to learn their way out of it. Other work cuts the other way. A well-known 1988 study found no significant winner’s curse in highway bidding, and experimental research has shown construction executives who fall for it in the laboratory routinely avoiding it in the field, through exactly the kind of industry-specific judgment that does not survive being rushed.
So it is better understood as an exposure than as a measured fact. But the exposure is structural, and it points back at Part 1: the bid that wins is, mechanically, the one built on the most optimistic reading of the documents.
The surety industry has priced that risk for a long time. The rule of thumb, stated by a surety professional and echoed as the bonding-industry benchmark in a 2016 study of state DOT bids, is that a spread of more than 10% between the low bid and the second bid “warrants evaluation before a performance bond is issued” — because the low bidder may have “left out an element, misread the plans or miscalculated.” That same study, covering 1,417 bids let by four state DOTs in 2015, found the average spread at six bidders was 5.4%, and classed 34% of the 1,301 bids in its final analysis set as “unfavorable” on combined spread and estimate-deviation criteria.
The same instinct is written into procurement policy at scale. The World Bank’s guidance on abnormally low bids tells borrowers to query any bid landing 20% or more below the cost estimate when fewer than five responsive bids arrive, or more than one standard deviation below the average when five or more do. Its rationale names the mechanism outright: such bids “are often submitted by contractors that may not be able to complete their work as priced or they may simply have made errors in their Bids and be unable to complete the work at that price.”
Read that against Part 1 and the loop closes. A missed spec section does not just become a change order. It is frequently the reason you were low in the first place. The bond underwriter has been reading your bid spread as a scope-miss detector the whole time.
A shorter bid list is not the good news it sounds like
Public work is the only place bid counts get published systematically, and there the trend is toward fewer bidders. Kentucky’s Legislative Research Commission examined 2,539 asphalt contracts let between January 2018 and July 2023 and found that “projects attracting more than two bidders are rare, having declined from 27.4 percent of total awarded projects in 2018 to 9.6 percent in 2023,” while contracts awarded to a sole bidder rose from 45.5% to 63.3%. Michigan DOT researchers — who had to scrape the bid tabulations themselves, because no state publishes the aggregate — found a mean of 3.92 bidders per contract in Michigan on 2016 data, and surveyed roughly twenty-five DOTs, of which sixteen reported four to six bids per contract and nine reported one to three. FHWA reports that the average number of bidders on federal-aid highway projects ran lower across 2022 through 2024 than in 2017 through 2021, while noting a possible reversal since mid-2023.
For a contractor staring at a short bid list, that reads like opportunity. The Kentucky data suggests reading it the other way as well: single-bid contracts were awarded at 100.5% of the engineer’s estimate, while contracts drawing two bidders came in at 93.5%. Owners pay more when nobody shows up. Which is another way of saying that the jobs nobody else wants to bid are often jobs that have earned that reluctance — and that being the only bidder is information about the job, not just about your competitors.
This is highway and asphalt work. No equivalent data exists for private commercial building, because nobody publishes it.
What saying no requires
The obstacle is rarely that nobody knows which jobs are bad fits. It is that declining them requires something most firms are short of.
Ron Tutor, CEO and Chairman of Tutor Perini, can simply refuse terms: “We basically take the position that you either negotiate with us something reasonable and acceptable to us, or we don’t bid.” That posture is real, and it is worth being honest about where it comes from — a $14 billion backlog and a heavy-civil market with very few firms capable of bidding the work at all. Most contractors do not have that leverage. Tutor’s own firm was posting a nine-figure quarterly loss on legacy disputes when he said it.
Without leverage, the pressure runs the other way. Stephen Brown, a bonding and surety specialist with McDaniel-Whitley, described the trap precisely: “you want to bid a job just to meet payroll, you want to bid a job just to meet your overhead. What you’re not seeing is that every time you do that, your overhead goes up.” Matt Verderamo, a consultant at Well Built Construction Consulting, writing in Construction Dive, names the version of it that starts in the field: “If you have a bunch of superintendents on staff with no job to send them to in a month, then what are you going to do? If you’re smart, you’re going to bid projects cheap so that you can cover the overhead associated with their salaries. While this can be a sensible business decision, it can also act like quicksand for your business.”
Writing in Construction Business Owner in 2007, Marla McIntyre, then executive director of the Surety Information Office, set out the warning signs of contractor failure. They read like a go/no-go checklist written by the people who pay when you are wrong: “bidding jobs too low,” “lead time to prepare bids too short,” and “increase in backlog without adequate project management resources.” Her companion list of unrealistic-growth signals adds the one most relevant here — “taking work the contractor doesn’t completely understand.”
And a governance point that experienced people raise more than any other. Porter warns against “end runs” around the process, and describes the specific one that matters here: “a business unit may delay asking for a ‘go’ decision, then claim it is too late for management to say ‘no go.’ The theory may be that commitments have been made to the subcontractors or JV partners, or that estimators have already done so much work and would be demoralized if the plug is pulled.” Sunk cost, wearing a hard hat.
What an actual filter looks like
The practitioners who have thought hardest about this converge on a few things, none of which require software to start.
The first is distinguishing between two different refusals. Carpenter draws the line between a reactive no and a strategic one, and Brown, elaborating on it, describes the difference in practice. The reactive version is “Hey, we’re full. Sorry, can’t do it right now. We’re slammed.” The strategic version says “This doesn’t fit in with our goals and plans” — a position “which you set with your entire team,” in advance, so that declining a job is the execution of a decision rather than an improvised excuse. Brown’s view is that owners can tell the difference, and respect the second.
The second is that criteria only matter if they bind. “If you have a structure in place that says no based on certain criteria,” Brown says, “then your project managers, your estimators, they’re just not gonna be allowed to do that. There’s just a lot of hidden cost in the yeses.” A filter that a business unit can talk its way around is not a filter, which is the same problem Porter identifies from the general counsel’s chair when he warns against end runs.
The third is keeping the decision away from the people carrying a number. Porter is blunt that business development staff “should not be making these decisions in isolation, as they are too close to the front lines, and when the pressure is on, their judgment about which projects are in the company’s overall best interest may be clouded.” His structural answer is a standing committee meeting often enough to catch fresh opportunities — “a scheduled meeting every one or two weeks may be about right” — and an organization comfortable with the outcome: “It is healthy for the organization to have occasional ‘no’ decisions, communicated promptly and directly, with an honest explanation of the reasons and the facts behind it.”
There is also a small academic literature on what contractors actually weigh, and its most striking feature is how stable the answers are across decades and continents. Shash’s 1993 study, mailed to 300 top UK contractors, found the top three bid/no-bid factors were the need for work, the number of competitors tendering, and the amount of experience on such projects. Ahmad and Minkarah, surveying the top 400 US general contractors in 1988, reported that “competition and profitability, although significant, are not the top-ranked factors” — judgments about the job and the owner outranked the arithmetic. And a 2024 study of 112 contractors in Saudi Arabia ranked, in order: the client’s ability to pay, clarity of scope of work, project cash flow, the need for work, and availability of a qualified workforce.
That second-place finish deserves a moment. In a very different market under a low-bid award regime, the thing contractors most wanted before committing — after confidence they would actually get paid — was to understand what the job actually was.
The fourth is knowing what you are actually good at. Hedley’s version is characteristically direct: “Bidding on projects with open bid lists wipes out your chances of making high margins. The only way to higher margins is bidding the right customers and projects, with the right profit margin potential and against the right competitors.” Verderamo’s diagnostic list asks, among other things, “Are we bidding too often?” and — the question that reframes the whole exercise — “Do we have a sales system? Or just a bidding system?”
None of that is exotic. It is mostly the discipline to decide in advance and then honor the decision under pressure. What makes it hard is that qualifying a job properly costs real time, which brings the problem back around to where it started.
The squeeze that makes this urgent
Two credible sources currently disagree in a way that should concern anyone running a preconstruction department.
BLS projects employment of cost estimators to decline 4% between 2024 and 2034, and says why in plain language: “Cost estimation software is improving the productivity of these workers, requiring fewer estimators to do the same amount of work.”
AGC’s contractors report the opposite experience. In the 2025 AGC/NCCER workforce survey of 1,342 respondents, 77% of firms with estimating openings reported difficulty filling them — the second-hardest salaried role that year, behind only superintendents at 81%, and the third consecutive year at or above 70%. AGC and Sage’s 2026 outlook found 80% of firms reporting a hard time filling salaried openings, “a higher proportion than at any point in the past three years.”
Both cannot be comfortable at once. The resolution is that the estimating capacity problem is not going to be solved by hiring. It will be solved by deciding, earlier and better, which documents deserve a human being’s attention at all.
The bottom line
Thomas C. Schleifer, a turnaround expert and former Arizona State University professor, puts it this way: “There are no bad projects - just bad matches of contractors to projects.” The matching is the work. And matching well requires knowing what a job involves before you have spent three weeks of senior time finding out.
That is the connection back to where this series started. The reason go/no-go decisions get made on instinct is that real qualification — reading the general requirements, finding the onerous flow-down clauses, spotting the unfamiliar scope, checking whether the schedule is survivable — costs almost as much as bidding the job. So firms skip it, commit, and discover the answer in week three. A complete, classified first read of a project manual in hours rather than weeks changes that sequence: you can qualify out on day two, on evidence, before the pursuit has eaten anything that matters.
Carpenter’s closing question is the one worth sitting with: “when was the last time you turned down some work that looked profitable on paper? And if that answer is never, you might have a problem… profitability is really not just what you win, it’s what you’re disciplined enough to walk away from.”
If you want to know what is actually in the next project manual before you commit an estimator to it, bring us one and we will show you what surfaces.
Sources: SMPS Foundation, Measuring for Success (survey July 2015, n=303, published Dec 2016); CFMA Construction Financial Benchmarker (2024, n=1,290); BLS Occupational Employment and Wage Statistics, May 2025 (SOC 13-1051) and Occupational Outlook Handbook; BLS Employer Costs for Employee Compensation, Q1 2026; AGC/NCCER 2025 Workforce Survey (n=1,342); AGC and Sage, 2026 Construction Hiring and Business Outlook (n=951); Alkhateeb, Hyari & Hiyassat, Construction Innovation 21(4), 2021; Ahmed, El-adaway, Coatney & Eid, Journal of Construction Engineering and Management 142(2), ASCE, 2016; Thiel, American Economic Review 78(5), 1988; Dyer & Kagel, Management Science 42(10), 1996; Delaney & Mohan, “The Effect of the Level of Competition on Construction Bid Quality,” 2016 (CMAA white paper, not peer-reviewed); Kentucky Legislative Research Commission, Research Report No. 488, Single-Bid Asphalt Contracts, 2024; Michigan DOT SPR-1717 (Western Michigan University), Dec. 2022; FHWA National Highway Construction Cost Index, 2024 Q3; World Bank, Procurement Guidance: Abnormally Low Bids and Proposals, 2016; Shash, Construction Management and Economics 11(2), 1993 (UK); Ahmad & Minkarah, Journal of Management in Engineering 4(3), 1988; Aldossari, Buildings 14(10), 2024 (Saudi Arabia); FMI and Procore, The State of Global Preconstruction 2022 (n=979, 25% US); Golia, “Bid Spreads,” Secrets of Bonding, 2014; Hughes, Greenwood & Hillebrandt (CIB) and the 2014 Bid Cost Survey, MarketingWorks with Prof. Will Hughes, via Constructing Excellence (UK); Matelan & Paré, FMI, “Professionalizing Preconstruction Services,” April 2024; Marla McIntyre, “Risky Business,” Construction Business Owner, May 2007; ContraVault AI and RFP Pros, The State of Industrial Estimation 2026 (vendor-sponsored survey, n=312, fielded Q1 2026, released July 2026); Tom Porter, Design Cost Data, 2020; Ron Tutor via Construction Dive, Nov. 2024; Ben Wilhelm, 2018; George Hedley, Construction Business Owner, 2012 and 2020; Matt Verderamo, Construction Dive, July 2025; Wade Carpenter and Stephen Brown, Contractor Success Forum, June 2026; Thomas C. Schleifer, The Secrets to Construction Business Success, via CFMA.
This post extends our series on the economics of preconstruction. For what hides inside the documents once you have committed to a bid, start with The Hidden Profit Killer in Every Spec Book, then From Missed Line to Change Order and What AI Classification Actually Changes in Preconstruction.